I’m a recovering numbers guy. In my banking and venture investing days over 20 years ago, I could build spreadsheet projections that were elegant, logical, perfect—and always wrong. Excel can lull you into feeling like a master of the universe. Spreadsheets with assumed growth rates spit out wonderful numbers that make you feel that “this is going to be good!”
Then reality hits. When I left the financial world to enter the rough and tumble world of business operations, it wasn’t long before I realized the folly of spreadsheet projections. I learned the basic truth of running a great business: build strong relationships with customers, prospects, allies, key vendors, and employees.
What Dealers Usually Focus On
Still, the numbers matter a great deal. As we work with our security dealer customers, it seems that most of them focus on two things:
- Revenue & revenue growth
- Net income
Those are both important. But due to the economics of this business, they can give owners a ‘head fake’ relative to what’s really happening with the business. A few companies we’ve worked with have split their business into two parts: the security service and installation business, and the monitoring / recurring services business. Those owners are on the right track. They have a much clearer picture of the true economics of these two very different revenue streams.
What Dealers SHOULD Focus On
Here’s a simple but powerful way to look at your numbers:
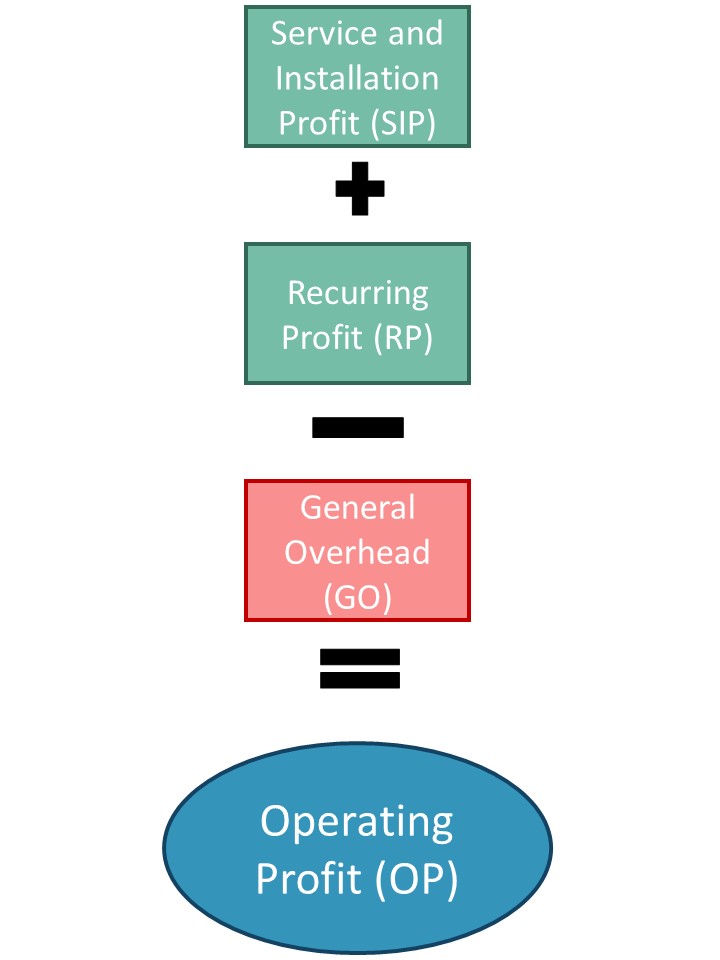
This approach separates income and expenses to create two clear profit “buckets” – the S & I bucket, and the Recurring bucket. These two simple buckets will drive your company’s success or failure, because they drive your operating profit margin. As an owner or operations manager, if you have a clear picture of your revenue streams and your monthly overhead “nut”, it’s much easier to set goals and understand things like breakeven point, minimum job margins, and so on.
Recurring Profit – Clean
Let’s start with the cleaner side – recurring. Needless to say, a security company’s base of recurring revenue is a great stabilizer. Our industry is attractive to investors because of this steady, high-margin revenue stream. Valuation is usually driven by recurring monthly revenue (RMR). Recurring profit is RMR minus direct expenses related to supporting that RMR: monitoring expenses, phone line expenses, billing expenses, some customer support costs.
Companies that have built a solid base of 500 or more recurring accounts should expect Recurring Profit (RP) margins of 60 – 80%. If a dealer has $70k/month in RMR, with $20k in recurring expenses against that, RP is $50k.
Key Relationship: Recurring Profit vs. Overhead
The relationship between profit on recurring and General Overhead (GO) is key. In the above example, if GO is $40k/month, there’s $10k/month in excess RP. That means that, short term, the company could survive even if S & I revenue was zero. Another way to approach this is to start with your overhead—your ‘nut’—and compare that to your RP. If RP is consistently $10k/month less than your GO, you know you need $10k+/month in margin from your Service and Installation profit bucket…very useful.
What Is Break Even?
Using this simple model, it’s easy to figure out your ‘break even’ point. For example, if:
- your average SIP margin is 33%, and
- you need $10k/month in SIP to cover overhead, then…
- what’s your break even service & installation revenue?
Answer: $30k/month…just divide your minimum SIP of $10k by .33. See how that helps set your sales agenda? To make money, you need to get out there and target $30k/month in S & I revenue, and probably more to have a cushion. If your “close rate” on quotes you issue is 50%, you need to be issuing $60k/month in quotes minimum to close on the $30k you need, and end up with your $10k+ break even SIP. Very, very useful.
SIP: Messy but Critical
The messy and more volatile side of the business is obviously the S & I bucket. Under pricing jobs can lower your margin and increase the revenue you need to cover the monthly nut. There are many other metrics you can look at to fine tune your SIP. For example, billable hours to total hours. If you pay a tech 8 hours/day, and that tech bills 7 hours/day, that’s a pretty high percentage. If they bill 50% of their time, you may be losing money on them. You should always be looking at job margins – but they can be misleading. The margin on a job can look great based on the time spent ON the job, but if there is lots of idle / unbilled tech time (travel, admin, lunch, etc.) the actual margin on the technician’s labor can be less than what you expect.
Keep It Simple
The simpler you make your key metrics, the more likely you’ll look at them on a regular basis, and use them to improve. This blog post introduces one approach. I’ll be elaborating on this model in future posts.